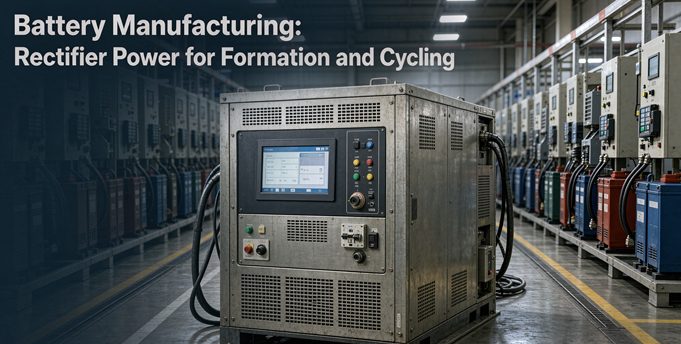
A lithium cell does not leave the line as a battery. It becomes one during formation, when a low, steady current grows a stable solid-electrolyte interphase over 10 to 86 hours, and during cycling, when repeated CC-CV steps sort cells into capacity bins. That power is low voltage and high precision, and it flows in both directions. Buyers keep asking for a “rectifier,” but what a formation line actually needs is a four-quadrant bidirectional supply that sources and sinks current, holds ±0.05% full-scale accuracy, and sends discharge energy back to the DC bus or the grid instead of burning it in a resistor. Get that distinction wrong and you pay twice: once on the power bill, once on the cells you scrap.
Numbers worth quoting
These are the figures we use below. Every one has a stated source or a stated assumption, so you can argue with the assumptions instead of guessing.
- Formation takes 10 to 86 hours per cell in published industrial protocols, and formation plus aging sits near 30% of cell production cost.
- A 3.2 V, 15 Ah cell holds 48 Wh. At 90% charge efficiency it needs 53.3 Wh from the source.
- Cell-to-cell energy recycling cuts that to 63.4 Wh for two cells instead of 107 Wh, a 40.5% reduction, using Analog Devices’ published arithmetic.
- A 512-channel aging field test reported 92.8% average efficiency, 35% lower energy than a resistive rack over 30 days, and a 0.4% drop in cell rejection.
- Module figures you will see in quotes: PF above 0.99, THDi below 5%, ±0.05% FS current accuracy, under 0.1% RMS current ripple, and 93% round-trip efficiency. None of those four numbers means the same thing.
- On a 100 A range, ±0.05% FS is ±0.05 A. Over a one-hour discharge of a 60 Ah cell that is 27.8% of a 0.3% capacity bin.
- Ideal six-pulse reciprocal harmonics produce 31.1% THD; twelve-pulse, 15.2%; twenty-four-pulse, 7.6%. A PWM front end with an active PFC stage behaves differently, and we explain where.
The short answer: you are not buying a rectifier
Start here, because the word shapes the whole RFQ.
Where the word came from
Lead-acid plate formation made the term stick. A plate-formation rectifier takes three-phase AC, drops it through a transformer, and uses thyristor control to push a regulated current through jars of plates for 24 to 120 hours. The output is 80 to 360 V, roughly 3 V per jar, with 20 to 100 A channels. One Indian supplier advertises ±1% current regulation, a ten-step profile, and a ripple figure near 90%. That is a fine machine for lead-acid. Its voltage, ripple and control assumptions do not transfer to a lithium line.
A lithium cell is a 2.5 to 4.2 V device. Formation channels are usually 0 to 5 V at the cell level, or a higher bus voltage when many cells sit in series on one fixture. When someone quotes you a “battery formation rectifier” with a 300 V output and 90% ripple, ask which chemistry they mean before you read another line of the datasheet. The two markets share a noun and almost nothing else.
What the four-quadrant machine does
A lithium formation or cycling supply runs as a controlled current or voltage source in all four quadrants. In plain terms, it can source positive current at positive voltage (charge), source negative current at positive voltage (discharge), and do both with either polarity while keeping the programmed profile. Internally that usually means an active-front-end AC/DC stage for the grid interface, a DC bus shared across channels, and an isolated bidirectional DC/DC converter per channel or per small group of channels.
That architecture answers the two questions a rectifier cannot:
- Can I give the energy back? In discharge, the channel boosts cell voltage up to the bus. Other channels use that energy to charge. Whatever is left goes through an inverter back to the facility.
- Can I hold the setpoint when the cell pushes back? Cell voltage swings from near zero at the start of first charge to its upper cutoff, and the impedance changes the whole time. A synchronous buck-boost or isolated full bridge stays stable down to 0 V. A simple buck-derived stage struggles with the duty cycle at low voltage.
Formation and cycling are two different electrical jobs
This is the part the explainer sites get right in chemistry and wrong in engineering. They will tell you formation builds the SEI and cycling tests performance. True, but it hides the equipment decision.
| Requirement | Formation (first charge) | Grading / capacity test | Cycling / aging |
|---|---|---|---|
| Main objective | Grow a uniform SEI, consume residual moisture | Measure capacity, DCIR, self-discharge | Repeat profiles, find early failures |
| Typical rate | 0.02 to 0.1C precharge, then staged CC-CV | 0.5C or 1C, full discharge | 0.5C to several C, application shaped |
| Duration | 10 to 86 hours, sometimes weeks with aging | 3 to 6 hours per full cycle | Days to weeks, hundreds of cycles |
| What the supply must nail | Very low current stability, near-zero voltage operation, low ripple | Current integration accuracy over hours | Fast transitions, four-quadrant crossover, data logging |
| Accuracy that matters | Setpoint stability at low current | Ah counting, ±0.02% to ±0.05% FS | Repeatability across thousands of steps |
| Recovery value | Moderate, first-cycle loss is irreversible | High, symmetric charge and discharge | Highest, many equal-energy loops |
One cabinet seldom optimizes all three. A high-performance channel with integrated EIS, 0.5 ms rise time and ±0.01% measured-value accuracy exists, and so does an economical channel with 5 ms rise, ±0.02% FS and 75% efficiency. Both are sold by the same vendor, for a reason. Formation floors want many stable, modest channels. Grading and aging want speed and repeatable measurement. If you buy one spec for every station, you either overpay at formation or lose accuracy at grading.
Bill one: the electrochemical side
Faraday does not negotiate
The charge you push determines the material you make or move. Current multiplied by time gives ampere-hours, and coulombic efficiency tells you how much of that shows up as reversible capacity. Voltage is the push needed to get the reaction to happen, not the thing you dial in to change mass.
For formation this has a blunt consequence. The first charge consumes lithium permanently in the SEI. Published cell data puts first-cycle coulombic efficiency in the high 80s for many systems, and the missing fraction is lithium you will never get back. No power supply recovers that. What the supply can do is keep the current uniform enough that the SEI grows evenly instead of in patches, because a non-uniform layer drives local plating and earlier fade.
That is why low C-rates dominate the first hours. A 0.02 to 0.1C precharge gives the electrolyte time to wet the electrode and the SEI time to form in a controlled way. Push 1C too early and you save clock time on a station while quietly writing variability into every cell that comes off it.
The 30% cost figure, read properly
A widely cited manufacturing table puts formation and aging at 32.61% of annual manufacturing cost and only 0.53% of cell energy consumption, about 0.07 kWh per cell. Those two numbers get used in arguments with each other, and that is a mistake. Cost includes equipment depreciation, labor and floor space, and formation holds cells for 1.5 to 3 weeks. Energy is only the electricity. A process can be expensive because it is slow, not because it is power-hungry.
Other sources report formation energy anywhere from 0.6 to 42.6 Wh per Wh of cell capacity, depending on the protocol and the boundary of the measurement. That spread is not noise. It is the baseline problem in one line, and it is exactly why abstract efficiency claims are worth so little in this market.
Bill two: the conversion side
Four numbers that are not interchangeable
Vendors put efficiency figures in bold type. Before you compare two quotes, make the salesperson name the denominator.
| Figure you see | What it actually measures | Typical range in this market | Why it matters |
|---|---|---|---|
| Converter or module efficiency | Power out divided by power in for one direction | 96% to 97% for isolated DC/DC modules | Sets heat load in the cabinet |
| Charge efficiency, AC to cell | Cell energy divided by grid energy on the charge leg | 80% to 90% in published systems | Sets the size of the upstream supply |
| Discharge recovery or regeneration efficiency | Energy returned to bus or grid divided by energy taken from the cell | 86% to 88.5% DC to AC; up to 93% round-trip claimed | Sets how much of the discharge you get back |
| Net plant saving | Grid kWh with recovery versus grid kWh with resistive dump | 35% field report, 40%+ cell-to-cell calculation | The only number that belongs in a business case |
A 93% round-trip figure means 7% of the energy is lost in the loop, not that your electricity bill falls 93%. If a rack draws 100 kWh to charge cells and returns 93 kWh during discharge, the grid still supplied 100 kWh at the meter and took 93 back. Savings depend on how much of the discharge you can actually reuse, and on when.
Where the headline saving figures come from
Analog Devices publishes the cleanest small example. A 3.2 V, 15 Ah cell holds 48 Wh. At 90% charge efficiency, filling it takes 53.3 Wh. Two cells with a resistive discharge need 107 Wh. Put the same cells on a shared DC bus at 90% recovery efficiency, and the first cell’s 43.2 Wh of recovered energy helps charge the second, so the pair needs 63.4 Wh. That is a 40.5% cut, and it is cell-to-cell recycling on a common bus, not grid reinjection and not a promise about your plant.
A field report from a module maker describes a 512-channel aging system for 18650 cells, 10 A per channel, 64 groups of eight channels on a 48 V bus with a regenerative inverter to the grid. Average efficiency came in at 92.8%, the system used 35% less energy than a resistive-load rack over 30 days, and tighter current control coincided with a 0.4% reduction in rejected cells. Those are useful figures. They are also one vendor’s test, on one chemistry, over one month.
Ripple is not a rounding error
Current ripple at the cell terminal shows up as small repeated perturbations on top of the programmed profile. Too much of it during SEI growth is associated with non-uniform lithium plating, which shortens life and worsens cell-to-cell spread. That is why a lithium formation module is specified below 0.1% RMS current ripple, while a lead-acid plate supply can quote a ripple near 90% without embarrassment.
Two design choices do most of the work: a high-bandwidth current loop, and interleaved power stages that cancel ripple frequency components. Ask for a ripple measurement at the cell terminals under load, not a figure measured at the module output with a fixture that filters it. Four-wire sensing at the fixture matters here too, because voltage dropped in a clip lead is voltage the cell never sees.
Accuracy becomes money at the grading station
Here is the calculation almost nobody publishes. Grading sorts cells into bins, and the bin width has to be at least two to three times the measurement uncertainty. Typical production bins are 0.1% to 0.5% of nominal capacity, so a 0.3% bin on a 60 Ah cell is 0.18 Ah wide.
What a 0.05% channel does to that bin
Now take a channel specified at ±0.05% of full scale on a 100 A range. That is ±0.05 A. Over a one-hour discharge it integrates to ±0.05 Ah, which is 0.083% of the cell’s 60 Ah, or 27.8% of the 0.3% bin. At ±0.02% FS the same channel contributes ±0.02 Ah, or 11.1% of that bin.
If the production spread is 0.5% standard deviation, a quick normal approximation says 13.3% of cells sit within one uncertainty band of a bin edge at 0.05% FS, versus 5.3% at 0.02% FS. Those are the cells that drift between bins when the fixture temperature changes or the shunt warms up. Contact resistance alone can shave 25 to 35 mAh off a reading as spring pins wear, which is enough to move a good cell down a bin on a 60 Ah part.
Scale that to a 1 GWh plant making 192 Wh cells. That is roughly 5.2 million cells a year. A 0.4% reduction in rejected cells, the figure from the 512-channel field test, is about 20,800 cells. At 8 to 12 dollars of material per cell, that is 167,000 to 250,000 dollars a year, before you count the pack rework avoided downstream. This is why we call accuracy a yield spec rather than a datasheet decoration.
A note on full scale versus measured value
Two suppliers can both quote “±0.02%” and mean different things. One states percent of full scale on the selected range. Another states percent of measured value plus a full-scale offset, as a premium tester does with ±0.01% of reading and ±2.5 mA offset. The second is usually better at low currents, where the offset dominates. Ask which, and ask which current range the number applies to. Arbin’s own grading note shows the current accuracy bound moving from about ±0.30% on a 5 A range to about ±0.06% on a 1 A range for the same test. Range selection is part of the accuracy decision.
Bill three: the plant side
A 1,000-channel case, with assumptions written down
Worked example, not a forecast. Change any assumption and the answer moves.
The assumptions
- 1,000 channels, 5 V and 100 A per channel, so 500 kW of installed peak conversion.
- 100 Ah, 3.2 V LFP cells, 320 Wh each.
- One full cycle every three hours including rests, 20 hours a day, 330 days a year. That is 2,200 cycles per channel and 2.2 million cell cycles.
- Cell energy throughput: 704 MWh a year.
- AC-to-cell charge efficiency: 96%, so 733.3 MWh drawn for charging.
- 85% of cycles are repeat cycling eligible for recovery; first formation cycles are not symmetric.
- Recovery chain from cell through DC bus and inverter to grid: 93%.
From recovered MWh to a dollar figure
Recovered energy is 704 × 0.85 × 0.93, or 556.5 MWh a year. Net grid draw falls to 176.8 MWh. Against a resistive-dump baseline of 733.3 MWh, that is a 75.9% reduction, or 556,500 kWh. At 8, 10 and 12 cents per kWh, that is 44,500, 55,700 and 66,800 dollars a year.
Then add the part that never appears in a module datasheet. A resistive rack turns roughly the same energy into heat inside the room. At the assumptions above, avoiding about 32 MWh of cooling work is worth another 2,500 to 3,800 dollars a year. Demand charges can matter more than either, because regeneration flattens the peak the utility bills you for. If your tariff charges a demand fee, model the half-hour peak, not just the kWh.
Two honest warnings. First, 75.9% is an output of our assumptions, not a supplier promise, and the 85% cycling share is the assumption most likely to be wrong on a new line. Second, grid reinjection needs a load somewhere on site to absorb it. If nothing is charging while a batch discharges, the bus voltage rises and the inverter must curtail. ADI’s unidirectional-bus example makes the point: the system has to be balanced so net current stays positive, or you need the more expensive bidirectional front end.
Harmonics when you give power back
A regenerative rack is a generator from the grid’s point of view. That changes the compliance question. A modern active-front-end module will quote power factor above 0.99 and THDi below 5% in inverter mode. Those numbers are measured at the module, under stated load. Your contract is measured at the point of common coupling, where IEEE 519-2022 applies to the whole installation.
Classical pulse rectifiers and the modern front end
Classical multiline rectifiers have a predictable harmonic fingerprint. Characteristic harmonics sit at kp ± 1, so a six-pulse bridge leaves the 5th and 7th, a twelve-pulse bridge leaves the 11th and 13th, and a twenty-four-pulse bridge leaves the 23rd and 25th. The ideal total distortion falls from 31.1% to 15.2% to 7.6% as pulse count doubles, with a 30 degree phase shift between two six-pulse bridges making the twelve-pulse arrangement. Each doubling is a factor near 0.49, not exactly half.
Most new formation lines do not use line-commutated thyristor bridges for the front end. They use IGBT or SiC active front ends with PFC, where the harmonic result comes from the control loop and switching frequency rather than the pulse number. The same IEEE 519 limits still apply at the PCC, and the strictest Isc/IL band allows only 5% TDD. If your site is electrically weak, ask for a harmonic study at the PCC with the rack at full regenerative output, not a THDi number copied from a module flyer.
Standards that belong in the RFQ
| Standard | Applies to | What to ask for |
|---|---|---|
| IEC 62477-1:2022 | Safety of power electronic converter systems, now explicitly including bidirectional converters, up to 1,000 V AC or 1,500 V DC | Declaration of conformity, CE-LVD file, and the exact edition. COR1:2024 is included in the current IEC copy. |
| IEC or UL 62368-1 | Product safety for the power module in many supply designs | Which edition and which national adoption the certificate uses |
| IEC 61010-1 | Measurement and test equipment safety | Relevant when the channel is sold as a measuring instrument |
| EN 55032 Class B | Conducted and radiated emissions | Ask for test margin, not just a pass, if the site has sensitive equipment |
| IEEE 519-2022 | Harmonics and TDD at the point of common coupling | A study at full regenerative output, with the site’s Isc/IL ratio |
| IEC 61000-3-2 / IEC 61000-3-12 | Harmonic current emission for equipment connected to the public network | Confirm which applies at the equipment’s rated current |
| ISO 17025 | Calibration laboratory competence | Traceable calibration certificates for current and voltage readback |
| IEC 62619 | Safety of secondary lithium cells and batteries | This is a cell standard, not a supply standard. Do not let a vendor use it as evidence for the power cabinet. |
European buyers should check the harmonised EN adoption of IEC 62477-1 and confirm the edition cited on the declaration, because national adoption dates differ by source. We will state what our certificates actually cover rather than fill this table with optimistic marks.
How to write the RFQ so vendors cannot dodge it
Twelve lines. If a supplier cannot answer these in a table, you will be comparing brochures.
The twelve fields
- Chemistry and format: LFP, NCM, pouch, prismatic or cylindrical, and nominal Ah.
- Cell voltage window at the fixture, including the near-zero start of first charge.
- Charge and discharge current per channel, and the current range the accuracy figure applies to.
- Formation protocol: number of steps, rates, cutoffs, rest periods, and total hours.
- Cycling or grading protocol: rates, cycle count, and required Ah repeatability.
- Target capacity bin width in percent and in Ah.
- Accuracy basis: percent of full scale or percent of reading, plus full-scale offset.
- Ripple at the cell terminals under load, with the measurement bandwidth stated.
- Channels per cabinet, channels per module, and how the DC bus is shared.
- Energy path: cell to cell only, cell to grid, or switchable, with the stated recovery efficiency for each.
- Interface and data: CAN 2.0B, Modbus TCP, 485, sampling rate, local storage and export format.
- Site and compliance: grid voltage and frequency, Isc/IL at the PCC, ambient temperature, and the certificates you require.
Two follow-ups that separate a real system from a brochure
Ask two follow-ups in every negotiation. What is the recovery efficiency measured at the grid meter, and what is the calibration interval and cost for the current shunts? Those two answers separate a system that saves money on paper from one that does it in year three.
Three mistakes we see in incoming RFQs
Requesting a 300 V rectifier for 5 V cells
Usually a lead-acid datasheet made it into a lithium project. The voltage is wrong by two orders of magnitude at the cell, and the ripple spec belongs to a different chemistry. Catch it before the quotation, because the transformer and the control topology are both different.
Reading 93% efficiency as a 93% saving
Conversion efficiency, round-trip efficiency, regeneration efficiency and plant saving are four different denominators. The module can be 96.5% peak and the rack can still save 35% versus resistive discharge. Put the baseline in the sentence or the number is not usable.
Specifying accuracy without specifying the bin
±0.05% FS sounds excellent until you set it beside a 0.3% bin. If uncertainty eats 28% of the bin, you are sorting on noise. Decide the bin first, then work backward to the instrument, the current range, the fixture resistance and the calibration plan.
FAQ
How much power does a lithium formation line actually draw? Per channel, multiply cell voltage by test current: 4.2 V at 100 A is 420 W at the top of charge, though most formation hours run far below that. A 1,000-channel rack at 5 V and 100 A per channel is 500 kW of installed peak conversion. Actual average draw depends on the profile, rest time and how much discharge energy you recover.
Is a battery formation rectifier the same thing as a cell cycler? No. A lead-acid plate formation rectifier is a transformer plus thyristor control at 80 to 360 V. A lithium cycler is a bidirectional, four-quadrant supply at 0 to 5 V per cell, with isolated channels and energy recovery. The keywords overlap; the machines do not.
What voltage range do I need per channel? For single lithium cells, 0 to 5 V covers the window from near-zero during first charge to about 4.2 V cutoff. Module and pack test racks run at higher bus voltages, commonly 360, 500, 750 or 1,000 V classes. Pick the class from the bus you are testing, not from the cell.
How much energy does regeneration really save? It depends on the baseline. A published cell-to-cell calculation shows 40.5% versus resistive discharge, a 512-channel field test reported 35% over 30 days, and a module maker quotes up to 93% round-trip efficiency. The last figure describes the conversion loop, not your bill. Model your own duty cycle and tariff.
What current accuracy do I need for capacity grading? Set the bin width first. Bins are commonly 0.1% to 0.5% of nominal, and measurement uncertainty should be two to three times smaller. For a 0.3% bin on a 60 Ah cell, ±0.02% FS on a 100 A range contributes 11.1% of the bin; ±0.05% FS contributes 27.8%.
What does ±0.05% FS mean in ampere-hours? On a 100 A range it is ±0.05 A. Over a one-hour discharge that integrates to ±0.05 Ah. On a 60 Ah cell that is 0.083% of capacity. Always ask which range the percentage refers to, because switching to a 1 A range changes the result by a factor of 100.
How many channels fit in one cabinet? Published systems range from 8 high-current channels to 384 channels at 5 V and 6 A, with 108 channels at 5 V and 30 A as a common middle point. Channel density is a thermal problem as much as an electrical one, so compare cabinets at full load and at your ambient temperature.
What ripple is acceptable during formation? Aim below 0.1% RMS current ripple at the cell terminals. Excessive ripple during SEI growth is linked to non-uniform plating and shorter life. Measure at the fixture with four-wire sensing, not at the module output.
Which standards should the supply comply with? Start with IEC 62477-1:2022 for converter safety, IEC or UL 62368-1 for the module, EN 55032 for emissions, IEEE 519-2022 for harmonics at the PCC, and ISO 17025-traceable calibration. IEC 62619 covers the cells, not the cabinet.
What information do you need to quote a formation or cycling line? Send the twelve items in the RFQ section above. The four that block a quote every time are chemistry and Ah, the cell voltage window, the exact formation and cycling steps, and your target capacity bin width. With those, we can size channels, recovery topology and calibration scope in one pass.